8. Full system empirical validation
8.1. PyroScanner measurement method
8.1.1. Introduction
Since the RadiCal method aims to accurately predict energy flows induced by solar radiation for “real-world” applications, the ultimate benchmark is empirical data gathered in natural conditions. In order to perform a conclusive validation, empirical data should have the following features: variation of the shading system, variation of the shading state as well as variation of direct and diffuse irradiance components. The measured data must comprise high-quality data for internally and externally measured irradiance and resolved information regarding the sky diffuse and direct irradiance. As no data fulfilling these requirements had been available, a dedicated measurement equipment and process was developed in the course of the PhD. The equipment was assembled with the kind support of the AEE INTEC measurement department (AEE INTEC, 2023). The author implemented the required software and firmware for the various components and performed all measurements. The equipment was later used for an alternative measurement method, covered in a separate publication (Rüdisser et al., 2021).
Performing measurements under natural conditions is a valuable method to determine performance data; however, it is linked to challenging and elaborate tasks. The measurements depend on many external parameters that cannot be controlled but must be determined as accurately as possible. For the present case, it can be stated that the irradiance behind a window shaded by Venetian blinds depends on the foloowing external, not controllable parameters:
- solar elevation angle (𝜃)
- solar azimuth angle (𝜑)
- diffuse irradiance (𝐷𝐻𝐼)
- direct normal irradiance (𝐷𝑁)
- global irradiance (𝐺𝐻𝐼)
- albedo (𝑎𝑙𝑏𝑒𝑑𝑜)
The three irradiance parameters are not independent of each other when an irradiance model is used to derive a parameter from the others. The albedo can be approximated as a constant value, although it actually exhibits a seasonal dependence as well as a dependence on solar angles and irradiances (as discussed in sections 8.1.11 and 6.2.4). The model for the irradiance represents an idealised case, as the actual irradiance profile is significantly more complex. Deviations from the modelled irradiance profile can mainly be attributed to inhomogeneous cloud patterns, varying reflections from objects on the ground, absolute air temperature and humidity levels or gradients, as well as to the concentration of scattering particles in the atmosphere.
Beyond these environmental factors, the irradiance behind the shaded window also depends on these controllable configuration parameters:
- shading type (𝑠ℎ𝑡)
- shading material (𝑚𝑎𝑡)
- window type or state (open/closed) (𝑤𝑠𝑡)
- slat angle (𝑎𝑛𝑔)
- window orientation (𝑤𝑜𝑟)
The usually uncontrollable parameter window orientation is here controllable since the testing facility at AEE INTEC allows rotation around its vertical axis. Still, the window orientation is considered an environmental parameter, whereas the remaining controllable parameters define the model that has to be processed using the RadiCal method. Each combination of controllable parameters [𝑠ℎ𝑡, 𝑚𝑎𝑡, 𝑤𝑠𝑡, 𝑎𝑛𝑔] defines a specific test case, represented by a distinct 3D model. Following the empirical measurements, SIOPs derived for the specific test cases are used to perform virtual measurements based on the recorded environmental parameters. In order to analyse the accuracy of the model versus the measurement, the quantities of internal irradiance 𝐸𝑖𝑛𝑡 and transmittance 𝜏 are determined based on the model and the measurements. The transmittance relates the internal irradiance to the external irradiance. Its definitions for the model and measurements are provided in the subsequent sections. While the two quantities are not independent, they allow different interpretations regarding the model’s accuracy.
Thus, for each test case, defined by a unique combination of controllable parameters, datasets represented by the two pairs form the basis to assess the quality of the RadiCal modelling:

As mentioned, the parameters albedo and window orientation are considered constants for each test case. Compared to the relevant definitions in the standards, the here-applied quantities of internally measured irradiance 𝐸𝑖𝑛𝑡 and transmittance 𝜏 are based on a more complex definition, as any realworld effects (shading and reflection by the reveal and window frame) and the significant spatial inhomogeneity of the irradiance caused by Venetian blinds are taken into account. In order to address this adequately, a novel measurement device and evaluation method have been established.
8.1.2. Measurement location
The measurement device is installed at the roof-top testing facility of AEE INTEC in Gleisdorf (lat: 47.1097°N, lon:15.7097°E; see Figure 118). The local altitude is 361 m MSL. The bottom side of the windows is located 10 m above the ground level (371 m MSL). The testing facility can be rotated into different compass directions. In south facing position, the distance between the testing window and the weather station is 9 m. The roof of the neighbouring building dominates the view to the south below the horizon (see Figure 120 top); however, the view on and above the horizon is mostly unob structed, apart from one tree in close distance and a few trees at a further distance. Likewise, the west view (Figure 120 bottom left) offers a largely unobstructed view of the horizon


The lab’s roof is surrounded by a glass railing reaching a height that is approximately 1 m lower than the bottom level of the window. The floor construction on the laboratory roof consists of steel grating panels mounted approximately 30 cm above a black roofing membrane (see Figure 120 bottom right).

8.1.3. Measurement setup
The basic measurement setup consists of two window-based pyranometer units and an additional, nearby weather station (see Figure 119). The two window-related sensors comprise a stationary externally mounted pyranometer and a moveable internal pyranometer. The external sensor is of type CM11 (Kipp & Zonen, 2023a) and is mounted at a lateral distance of approx. 40 cm to the window. The device is oriented upright, i.e. parallel to the plane of the window element. The external sensor is used to determine the incident irradiance on a plane parallel to the window. Additionally, the high-performance sun tracker unit SOLYS2 (Kipp & Zonen, 2023b), part of the AEE INTEC weather station, monitors the incident diffuse and direct irradiance with high accuracy. All internal and external irradiance measurements are recorded with a 1-second resolution.

The unique feature of the PyroScanner is that the internal pyranometer is mounted on a platform that can move freely behind the window. This is realized by a self-developed, lightweight 3-axis leadscrew router platform, as used in CNC manufacturing. The necessary components were assembled in the AEE INTEC laboratory with the assistance of the measurement department. Many required components were created using a 3D printer. Table 15 provides an overview of the key hardware components used.

To be able to perform the complex measurements, a framework of specialized software had to be implemented. The implementation was performed in several different programming languages: C++ for the microcontroller firmware, PHP for the web service used to control the measurement, JavaScript and HTML for the web client to monitor and launch the measurements and finally, Pascal (Lazarus) in combination with SQL for the evaluation and measurement database. The PyroScanner features two different operation modes: a point-mode allowing stationary measurements for

extended time spans at changing positions and a tracking-mode in which the internal pyranometer is constantly moving, and measurements are taken on the fly. The latter operation mode is not covered in the thesis, as it was later added for a different project (Rüdisser et al., 2021).

The measurement sequences can be defined in a versatile way. The GRBL programming language, used in CNC manufacturing, was extended to additionally provide functions for controlling the pyranometer measurements. This allows the definition of specific measurement scripts to perform measurements at a series of defined locations automatically. The following parameters can be controlled individually:
- location of the pyranometer (x,y,z)
- speed and acceleration of the movement
- interval between measurements (in milliseconds)
- duration of the measurement (in milliseconds)
8.1.4. Calibration
A co-location calibration was performed to calibrate the voltage signal of the internal sensor against the already calibrated irradiance values provided by the external pyranometer. The co-location calibration ensures that both pyranometers receive the same irradiance, in terms of absolute value, but importantly also regarding the spectral and angular distribution. For this purpose, the internal pyranometer is mounted on a 3Dprinted fixture to ensure that both pyranometers are aligned in the same plane and face in the same direction (see Figure 124).

The actual calibration turned out to be challenging, as the indoor pyranometer or its combination with the used A/D converter resulted in non-linear behaviour for low irradiance values. The values above 75 W/m², however, showed an excellent linear correlation with 𝑅² = 0.9997. In order to ensure that hysteresis effects or erroneous signal processing were not the origins of the observed, strongly non-linear behaviour, the calibration measurements were repeated for increasing (sunrise) and decreasing irradiance (sunset). Furthermore, additional measurements were taken using an artificial light source (tungsten lamp). All measurements confirmed that the calibration results were repeatable and unambiguous. Therefore, the measured data could be used to derive a calibration curve for the PyroScanner measurements.
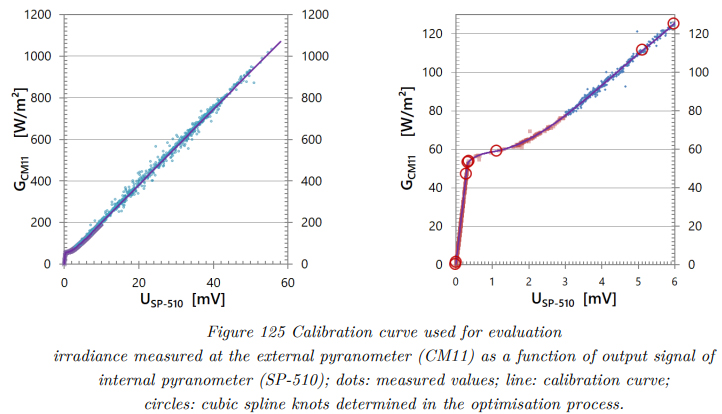
The calibration was split into a linear and a non-linear segment to account for the specific behaviour detected. The non-linear segment was extended to 125 W/m² to provide a continuous transition into the linear segment. Again, the knots of a cubic spline function were optimised to fit the underlying data by applying the simulated annealing algorithm (see section 5.2).
The approach turned out to be appropriate since the established spline function is able to fit the measured calibration data with high precision. The coefficient of determination 𝑅 2 for the fit of the Figure 124 colocation calibration of internal pyranometer Full system empirical validation RadiCal, D. Rüdisser 191 3203 calibration points reached a value of 𝑅 2 = 0,99992. Hence, the sophisticated calibration is able to compensate for the severe non-linearity of the sensor. However, this was only possible by using a high-precision analogue-to-digital converter that allows to capture the voltages with high precision. The steep slope of the signal in the range below 50 W/m² still increases the statistical errors of the measurements in this range.
The time-resolved functions of the irradiance data measured by both pyranometers during the calibration process were subsequently used to analyse a potential time shift between the measurement signals. Correlation analysis revealed that the signal of the CM11 device trailed the SP-510 device signal at a mean time lag of 5.5 s. This is in good accordance with the exponential time responses stated by the data sheets of the two devices. The SP-510 specifications indicate a (not further specified) ˝time response˝ value of 0.5 s, which presumably reflects the time constant at which the sensor reaches 1 − 1 𝑒 (≈ 63%) of the final value. The CM11 data sheet is more concise, as it specifies 15 s for the sensor to reach 95%. This can be converted into an exponential time constant of 5 s, thus validating the results of the correlation analysis. Consequently, the determined time lag was applied to compensate for the time lag between the two sensors in all measurements.
8.1.5. Prevention of internally scattered light
In order to focus on the window and shading, a black catcher plane (see section 7.10.2) is located directly behind the defined measurement area in the model. It ensures that any light passing the measurement plane is absorbed. A similar configuration is established for the empirical configuration by placing a black curtain behind the PyroScanner device. However, the curtain had to be located at an approximate distance of 1 m behind the window plane to allow free movement of the cable chains.
The remaining surfaces of the floor, walls and ceiling are covered with white boards. The light reflected from these bright surfaces is reflected back to the window or shading and further into the sensor, especially on measurements with a negative slat angle and high solar elevation (see Figure 126 right). Dark covers should be applied to these surfaces for future measurements.

In addition, the metallic lead screw and rail of the PyroScanner reflect irradiance back to the window and shading and further into the sensor. Due to the limited area, this effect is considered to be less Full system empirical validation RadiCal, D. Rüdisser 192 relevant for diffuse irradiance. However, it might occasionally affect some measurements if direct radiation is reflected at specific angles.
8.1.6. Determination and adjustment of slat angle
The slat angle is an essential parameter that must be determined accurately. In order to do this efficiently, a gauging tool was designed and realized using a 3D printer. The tool can be clipped tightly to the slats to indicate the plane that is formed by the slat’s two edges. Photos taken at a further distance in the normal direction to the tool were then used to determine the angle of the slats by applying photogrammetry. The angles were measured against vertical elements of the window frame but are defined as angles relative to the global horizontal plane. Hence, the correct vertical alignment of the window had to be verified first by using a plummet. The angle determination was applied repeatedly to examine its accuracy and ensure that the position of the slat could be moved into the same position with sufficient accuracy. The total error of the method is estimated to be approximately 3 degrees. The process

was carried out for several different angles to derive a function that provides the slat angle based on the motor’s driving time. This function was individually determined for each slat mounted for the tests.
In order to adjust the slats to a specific angle, the shading device was first fully opened, then closed (i.e. extended to full length) and finally rotated for the specific driving time provided by the determined function. The automation system of the testing facility allows controlling the motor driving time with a temporal resolution of Milliseconds.
8.1.7. Evaluation method for the empirical measurements
Evaluating the transmittance for homogenous irradiance profiles, e.g. behind unshaded windows, is trivial as the measured transmittance can simply be determined as the ratio of the internally and the externally measured irradiance values.

The subscript 𝑐𝑜𝑔 indicates that the measurement has been performed at the centre of glass (further specified in sections 8.1.8.1 and 8.1.8.2), whereas the subscript 𝑠𝑦𝑠 indicates that the measurements consider the full system. The 𝑠𝑦𝑠 subscript distinguishes the quantity from the theoretical quantity as this is based on a calculation that assumes infinitely extended objects. By contrast, the measurements performed here include all effects related to the specimen’s finite size (e.g. shading and reflections of the reveal). In order to determine the transmittance of objects causing an inhomogeneous distribution of the irradiance profile, a more sophisticated evaluation is required. To determine the Figure 127 Photogrammetric determination of slat angle using a 3D-printed tool Full system empirical validation RadiCal, D. Rüdisser 193 transmittance of the entire window, many measurement locations can be evenly distributed in the entire internal reveal area, and a statistical evaluation method can be applied (Rüdisser et al., 2021). In order to validate the accuracy of the RadiCal method, it is more efficient to primarily focus on the light scattered by the shading device and the glazing. For this purpose, the just introduced centre-of-glass transmittance is generalized to be applicable for shading devices that cause a vertically periodic irradiance profile. The measurement comprises 𝑁 sequential measurements taken at vertically distributed equidistant locations in a short period of time. The spacing of the measurements is chosen in a way that 𝑀 measurements represent exactly one periodic length 𝑙, whereas 𝑁 ≥ 𝑀 (see Figure 128). The empirically determined transmittance 𝜏𝑐𝑜𝑔,𝑠𝑦𝑠,𝑚𝑒𝑎𝑠 can then be written as:

While the transmittance is now defined as a mean value, the added superscript lines indicate that the used irradiance values are, in turn, based on mean values.

The applied averaging method creates a set of 𝑁 − 𝑀 + 1 virtual submeasurements (see Figure 128). Each of these virtual measurements covers a distance representing the periodic length of the shading device. While these measurements cannot be considered independent because they are based, to varying degrees, on the same measurements, they still enhance the statistical quality of the results, as they cover slightly deviating spatial and temporal regions. Hence, all parameters relevant for the evaluation of the sub-measurements, i.e. the irradiance values measured by the weather

station, the location of the sun and parameters derived from these values, are determined for each sub-measurements specifically and stored along with it.
8.1.8. Measurement specifications and model evaluation
8.1.8.1. Centre-of-glass approach
A centre-of-glass approach was pursued in the validation measurements, applying to both the empirical and model measurements. This means that the measurements are located in the centre of the unobstructed, visible part of the glazing. The reason for choosing this approach is twofold. First, the measured data at this location allows, to some extent, comparison with results that are determined with the currently applied methods. Commonly used values are calculated based on the assumption of infinitely extended elements, neglecting boundary effects caused by surrounding elements. While the present measurements do consider these effects in both the model and the empirical measurements, their impact is least significant at the centre of the unobstructed glazing. Second, the virtual model measurements require the detection of the irradiance on a sufficiently large detector area. For efficiency reasons, it is not practical to perform model measurements on an area representing the actual size of the pyranometer detection area, as this would require significantly longer computation times. While the different dimensions of the detection areas have a limited impact on most measurements, a significant deviation occurs when the shadow boundary of the direct solar radiation passes the detection area. Therefore, these times, i.e. solar angles, were excluded from the evaluation (see shadow boundary filter in section 8.1.12). In order to optimise the times when this shadow boundary filter is active, the measurement region is located in the centre of the glazing. If the measurement areas is horizontally located near the window frame, the shadow boundary of the opposite side would hit the area at higher incidence angles, making its determination harder.
8.1.8.2. Measurement location and spatial resolution
For the reasons just stated, the measurement region is located in the horizontal centre of the visible glazing. Regarding the vertical position, the measurement region is positioned near the geometric centre of the glazing; however, slightly offset below the centre of the visible area by 85 mm (depicted as a red rectangle in Figure 129). The vertical offset takes the mean elevation of the sun into account, as most measurements were performed with relatively high solar elevation angles during the summer period with a south orientation. The unshaded area is, therefore, vertically offset to the bottom side.
The dimensions of the model measurement region are 160 mm x 145 mm. It is essential that the height of the rectangular measurement region in the model equals exactly one vertical slat distance of the blinds or a multiple thereof. For the validation measurements, a height equalling two slat dis

tances is chosen. The detected irradiance behind the blinds generally exhibits a pronounced periodic spatial variation. Hence, the model measurements have to detect the mean irradiance value for (integer) N slats in the vertical direction, as only this value correctly represents the average irradiance representing the extended system.
The empirical measurement locations for the internal pyranometer, defined in the PyroScanner measurement script, are horizontally aligned with the centre of the glazing. Vertically they are centred around the model measurement region. It is not necessary to align the vertical extent of the measurement path to the slat distance, as the evaluation process considers the periodicity of the irradiance. Therefore, the PryoScanner was programmed to perform 80 measurements with a vertical spacing of 2 mm equaling a vertical track length of 160 mm (see the black track in Figure 129).
8.1.8.3. Temporal resolution and duration
Regarding temporal resolution, the programmed algorithm allows the definition of an idle lead interval before the measurement and an active interval in which the sensor data is recorded. The idle time was set to 400 ms to allow a mechanic and electric stabilization after the movement. The active measurement interval was set to 600 ms. Several hundred independent measurements are captured from the AD converter during this period. The mean value of all measurement readings and their standard deviation is stored in the database for each measurement spot.
The chosen interval parameters are a compromise, as they have to satisfy two conflicting requirements. On the one hand, the exponential response time of the pyranometer demands long measurement periods to allow for the stabilisation of the signal. On the other hand, the comparison against model measurements can be performed best if the conditions (solar angle, direct and diffuse irradiance) do not vary significantly over one measurement cycle. Regarding the typically delayed response of the sensor, it must be noted that even if the pyranometer might take several seconds to adapt from a shaded location to an exposed location, shorter measurement intervals can still be applied. The device’s exponential response symmetrically lags on the rising and falling edges of

the signal (see Figure 130). Hence, the integrated signal can still reflect the expected true value as the measurement errors made on the rising and the falling edge compensate. Consequently, the required condition is not that a single interval is sufficiently long but that the measurement period of subsequent samples is long enough to reach the „full“ signal.
On top of the defined measurement intervals, the control and drive time of the PyroScanner has to be considered to determine the actual temporal resolution of the measurement. The relevant period can directly be derived from the recorded measurements, as every measurement reading is stored with a timestamp with sub-second precision. The average time interval between two neighbouring measurements is 4.16 seconds. Therefore, the total time required for one measurement cycle comprising 80 individual measurements is 333 seconds.
8.1.9. Model used for determination of SIOP
The 3D model used for the raytracing process was generated with the tools FreeCAD (FreeCAD Project association (FPA), 2022) and Blender (The Blender Foundation, 2023). The window frame and glazing were modelled based on original 2D-CAD data provided by the window manufacturer (KATZBECK Fenster GmbH, 2022). The shading devices were modelled using 2D-CAD data provided by the shading manufacturer (Wo&Wo GmbH, 2022). The dimensions of the window reveal, as well as mounting specific parameters, were measured at the site. A rendering of the model performed with the RadiCal algorithm and the materials used for the SIOP generation is depicted in Figure 116. The relevant material assignments are provided in Table 25. In particular the materials of the glazing panes and shading slats are significant for the internal irradiance measured at the centre of the glazing. The materials of other surfaces have a minor impact. Therefore, generic material definitions were used to model these surfaces. The glazing’s internal and external surfaces were modelled based on the specific spectral measurement data applying the inversion approach covered in section 4.12. Specific information regarding the material’s spectral data and resulting refractive index functions for the coated and uncoated glazing are covered in the examples contained in section 4.12.3. The material of the polymer-coated slats was de

rived using the inversion approach for the subsurface reflectance function covered in section 4.13. Again, the material data of the slats correspond to the examples covered in section 4.13.3. All related information regarding the spectral input data and results of the inversions can be found in this section.

8.1.10. Evaluation method for model measurement
Following the principles of the RadiCal method, the model measurement can be performed by evaluating the corresponding SIOP for the measured irradiance profile. The evaluation of the SIOP is performed by applying the Perez diffuse sky model (see section 6.2.3). By applying equation (125) and denoting the SIOP that measures the irradiance behind the window at the centre-of-glass position (see Figure 129) as 𝑆𝐼𝑂𝑃𝐸𝑐𝑜𝑔 the internal irradiance 𝐸𝑖𝑛𝑡,𝑚𝑜𝑑𝑒𝑙 behind the window can be determined by:

The evaluation is an application of the method described in section 6.2.3. The irradiance values 𝐷𝑁𝐼, 𝐷𝐻𝐼, 𝐺𝐻𝐼 are the average values for the measurement interval of the corresponding measurement. 𝐹1, 𝐹2 and 𝑏 are the Perez parameters. are the relevant visible solid angels. For the vertical orientation of the windows, the solid angles are. The SIOP average values 𝑆̅ 𝑠𝑘𝑦, 𝑆̅ 𝑔𝑛𝑑 and 𝑆̅ ℎ𝑜𝑟𝑖𝑧𝑜𝑛 are precalculated, whereas the direct radiation term (𝑆𝐼𝑂𝑃𝐸𝑐𝑜𝑔(𝜃,𝜑)) is evaluated for every measurements using the average values for solar angles 𝜃 and 𝜑 during the corresponding measurements.
In analogy to equation (136), the modelled internal irradiance is related to the external radiance to determine the model transmittance 𝜏𝑐𝑜𝑔,𝑠𝑦𝑠,𝑚𝑜𝑑𝑒𝑙, measured at the center of glazing (𝑐𝑜𝑔) and considering the entire window system (𝑠𝑦𝑠):

The external irradiance 𝐸𝑒𝑥𝑡,𝑚𝑜𝑑𝑒𝑙 is the direct and diffuse irradiance on the window/façade plane calculated by applying the Perez model for the diffuse component, equation (119).
8.1.11. Albedo values
The albedo value characterising the reflectance of the environment remains the only undetermined quantity of the evaluation process based on equation (139). The evaluation can therefore be used to determine the albedo values empirically. It has been found that the sensitivity of the internally measured irradiance ranges from 0.1% to almost 1% per 1% change of albedo, depending on the test case. Since it would contradict the objective of the validation to individually optimise the albedo value for each case, three different constant average values were assigned to the 23 cases. It is important to note that the validation measurements and evaluations demonstrated well that the constant albedo approach is linked to significant inaccuracies, as already discussed in section 6.2.4. In particular, the bright roof located in the immediate south neighbourhood of the testing facility and tilted towards it (see Figure 120 top) affected the results of the measurements by directing significant amounts of direct solar radiation towards the target. In contrast, the dark membrane on the lab roof (see Figure 120 bottom-right) exhibited a relatively low albedo value. Its albedo value was determined in another project to be 8%. In order to accurately model such an environment, an approach as proposed in section 6.2.4 has to be followed. Since the approach is currently not fully implemented and should be the subject of a future separate study, a crude model based on the same idea is applied: For all south-facing cases with a significantly “downward-looking” SIOP the albedo value of 8% is used. This reflects the fact that the tilted slats effectively filter radiation originating from the floor (lab roof). The downward-looking criterion is defined to be relevant for all shaded cases with at least 45 degrees tilt angle. For all other cases, the opposite roof’s reflection must be considered; therefore, a value of 15% is applied for these cases.
Finally, an albedo value of 11% is applied for the single, unshaded west-facing case since meadows, trees and shrubbery dominate the environment in this direction.
The three-value approach considers the conflicting requirements of the evaluation. The constant albedo values were derived from the overall measurement results; however, they are not optimised for each of the 23 cases, which would lead to better validation results. All determined albedo values lie within a plausible range.
8.1.12. Comparison of model measurements and empirical measurements
8.1.12.1. Definition of error measures
In order to assess the quality of the results achieved in the model measurements, the following parameters are derived and provided in tabular form for each test case:
1. Mean error of transmittance
The mean error indicates the bias (or offset) of the model reconstruction vs. the measured transmittance. This quantity is considered the most important measure. It is dimensionless and effectively relates the error of internal irradiance to external irradiance. Using relative errors is less appropriate, as these increase inversely proportionally to the transmittance values.
2. Mean absolute error of transmittances

The mean absolute error of transmittance measures the average error of the model prediction vs. the measured values. Unlike the (signed) mean error, it also considers the statistical deviations resulting primarily from variations in the empirical values.
3. Standard deviation of error of transmittance

The quantity is a measure of the variation of the observed errors around the mean error of transmittance.
4. Mean absolute error of internal irradiance
The mean error indicates the average absolute error of the modelled internal irradiance in comparison to the measured value. It considers statistical variation and a systematic offset.
5. Linear regression through the origin of internal irradiance values
A linear regression through the origin can be applied since both the calibrated and model measurements converge towards zero as the solar irradiance diminishes. In the evaluations, the slope of the fit line, as well as the coefficient of determination 𝑅² are provided.
6. Linear regression of internal irradiance values
Additionally, a standard linear regression is applied. In the evaluations, the slope and the intercept of the fit line, as well as the coefficient of determination 𝑅² are provided.
Note: It is essential to point out that the regression analysis on the irradiance measurements (5. and 6.) only allows relevant conclusions if sufficient data points are available and if their values are spread over a sufficiently large range. Only some of the test cases fulfil this requirement.
8.1.12.2. Treatment of unshaded cases
In order to apply the same evaluation process as for the shaded cases (section 8.1.7), the internal and external irradiance values, as well as the weather station data, were averaged for 1-minute time periods. Each of these averaged values was subsequently evaluated as an individual measurement.
8.1.12.3. Filtering
Before the comparison is performed, four different filters are applied to the data in order to improve the quality of the comparison. The function and purpose of each filter are described below.
8.1.12.4. Irradiance consistency filter
The model measurement results are generated based on a SIOP evaluation using the Perez irradiance model (see section 6.2.3). For this reason, it is necessary to provide the irradiance components 𝐷𝑁𝐼, 𝐷𝐻𝐼 and 𝐺𝐻𝐼. For the validation measurements, these values are provided by the weather station of the laboratory, based on the calibrated and highly accurate sun tracker device and the associated pyranometers. Apart from using the irradiance components for the SIOP evaluation, they are also used to determine the total on-plane irradiance for the incidence plane parallel to the glazing. The standard formula to determine the irradiance on a vertical plane is used for this purpose.

As the external pyranometer of the PyroScanner directly measures this on-plane irradiance, the above equation was used to derive the initially unknown albedo value. By minimizing the mean errors of the calculation vs. the measurement, the average albedo value for the south-oriented unshaded case was determined as = 0.15. Two additional values were applied in the evaluations (see section 8.1.11).
Beyond the determination of the albedo, the comparison of the calculated vs. the directly measured on-plane irradiance is performed for every measurement. Significant deviations between the two irradiance values can arise. They can be attributed to two different causes:
1. Reflection spots from highly reflecting surfaces on the laboratory roof or the surrounding environment can hit only one of the two sensors or both with varying irradiance.
2. The Perez diffuse sky model only inadequately describes the current irradiance profile (e.g. due to pronounced broken cloud patterns).
As both cases do not allow a meaningful comparison of the Perez-based SIOP evaluation vs. the measurement, variations of the modelled to the measured on-plane irradiance are only accepted up to a specified threshold. In order to not exclude too many measurements from the evaluation, a threshold of 10% is defined. The irradiance consistency filter can, therefore, be stated as:

It must be noted that the application of this filter is not a shortcoming of the model but a requirement that results from the chosen validation method based on real conditions. Since the SIOPs are evaluated using the Perez irradiance model, it has to be ensured that it adequately describes the current sky condition, as only these conditions allow meaningful validation. Alternative sky models or lab lighting conditions would be associated with different irradiance profiles that could as well be evaluated using the SIOP concept.
8.1.12.5. Minimum irradiance filter
Only measurements with global irradiance on the incidence plane greater than 10 𝑊/𝑚² were considered in the evaluation. The reason for that is that even pyranometers of class A typically show errors in the range of a few 𝑊/𝑚² that are related to environmental temperature change, thermal radiation and electronics. The relevant standard (ISO 9060, 2018) states an acceptable “total zerooffset of ±10 𝑊/𝑚²” for class A devices.
8.1.12.6. Shadow boundary filter
As stated above, the slightly different definitions of measurement regions in the model and empirical measurement lead to systematic variations of the determined irradiance values in times when the shadow boundary of the direct radiation passes over them. It is important to point out that the shadow boundary filter does not have to be applied because one of the measurements provides faulty results but because the results of the model and empirical measurements do not correspond during these periods.
Based on geometric considerations, the shadow boundary filter was defined based on the incidence angle. In vector form, the filter can be written as:

This effectively means that measurements are excluded when the incidence angle of direct sunlight ranges between 67.2° and 84.0°. Hence, all measurements with an incidence angle in the range of 0° to 67.2° (potential direct exposure) and 84.0° to 180° (diffuse exposure only) pass the filter.
8.1.12.7. Outlier filter
Outlier removal is only applied very cautiously, as significant outlier removal could cause an increase in the correlation measures. Outliers can, e.g., be caused by specular reflections on the internal or external pyranometer, shadings by staff working on the testing facility or electromagnetic interference. A 3-sigma approach was applied to filter such outliers:

In general, less than 2% of the data is effectively filtered based on this criterion. Hence, the impact on the correlation and error analysis is considered minimal.
8.1.13. Test cases and specimen specification
Figure 132 shows the 3D models used for the slats. The models as well as the actual shading devices were provided by WO&WO Sonnenlichtdesign GmbH & Co KG (Wo&Wo GmbH, 2022). The model K80 has the traditional C-shape, with folded edges on either side. The slat width is 80.0 mm, the total height is 11.7 mm, and the folded edges’ external radius is 4.3 mm. The model VZ90 is a Zshaped profile with folded edges on either side. The slat width is 93.5 mm, the total height is 10.4 mm and the external folded edge radius is 3.0 mm. Both slats are modelled as 3D solids. The thickness of the coated aluminium profile of both slats is 0.44 mm.

The wireframe models of the slats as depicted in Figure 132 are sufficiently detailed as they include information on the orientation of the surface normals. This information is used in the smooth-shading feature (see sections 7.3 and 0) to reconstruct the slat’s reflectance smoothly.
Three different coatings were tested for the K80 slat type and one coating for the VZ90 slat type. Figure 133 provides an overview of the four slat specimens that were used in the validation measurements.

Several different slat positions were analysed in the tests. In order to gather more data for the validations, the tests were performed with and without the influence of the glazing. To perform measurements without glazing, the window sash was opened at an angle of 90° degrees into the room. The cases that could be evaluated do not cover the potential parameter range in a regular way. Some cases had to be discarded due to the unavailability of the testing facility. In other cases, the measurement readings were erroneous or missing, either from the weather station or the internal measurements. Many of the tests were controlled and monitored remotely, and all tests had been carried out before the evaluation method was implemented. Hence, it was not possible to repeat unusable measurements in the course of the project. Still, 1061 single measurements for 21 separate shadowed cases were evaluated. Additionally, the shading was fully retracted, and measurements were performed with a stationary internal pyranometer located at the centre of the glazing. The measurements were averaged over 1-minute periods to apply the same evaluation as for the shaded cases.
These measurements were performed for two different orientations of the window (south and west facing). Based on this approach another 9438 measurement points were evaluated for the two unshaded cases. An overview of all validation test cases is provided in Table 17.
